When writing a treatment/progress report, you may want to consolidate your data so that it shows the average across a period of time rather than each individual data point. Motivity has features that allow you to calculate or present your data as averages across months, weeks, or days AND a feature that calculates the weighted average across a specified data range.
View/Calculate the average occurrence/performance across a specific time-frame
To calculate the average occurrence or performance for a specific time frame follow these steps:
1. Go to the target graph.
2. Select a custom time frame from the data range configuration above the graph on the far right or simply highlight the time frame on the graph.
3. See the calculations made automatically on the bottom left corner under the graph.
-png.png?width=688&height=516&name=mceclip1%20(29)-png.png)
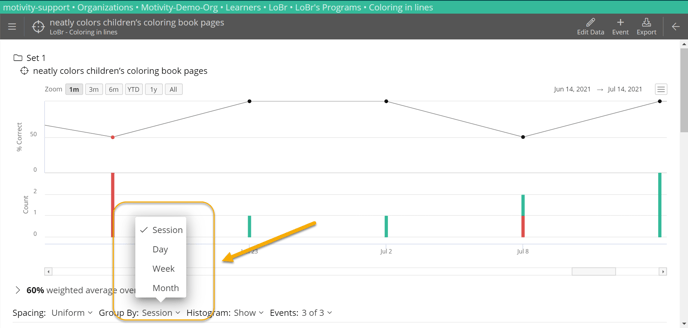
Aggregating data across days, weeks, and months on your graph
View the graph of interest by clicking on the program and then the target. The default graph will display data for the past month. You can change the date range by clicking the buttons in the top left corner. There is an option to see data from the past month, three months, six months, one year, year to date, and all existing data. You can also enter custom data ranges on the right side of the graph so you specify a date range. 
To change the averages, click on the "Grouped By" drop-down menu located under the graph. You have the option to group the data by month, week, day, or individual session. Select your preferred grouping and date range. You can then download the graph and add it to your report.
Weighted Average:
- with one score of 20% (2 out of 10 opportunities correct)
- the other score of 50% (1 out of 2 opportunities correct)
the weighted average would be 25% (3 out of 12 opportunities) rather than 35% [non-weighted: (50%+20%) / 2 sessions].
Last reviewed: 4/24/2023