Accessing/Editing Cumulative Graphs
This article reviews how to find and use Cumulative Progress Charts in Motivity. The chart will show a cumulative record of all targets moving in and out of your selected phases and include a list of those targets below the chart.
You can view a cumulative chart of target progress at 3 levels:
- Across all targets in a program type
- At the program level
- At the set level
Across all Targets:
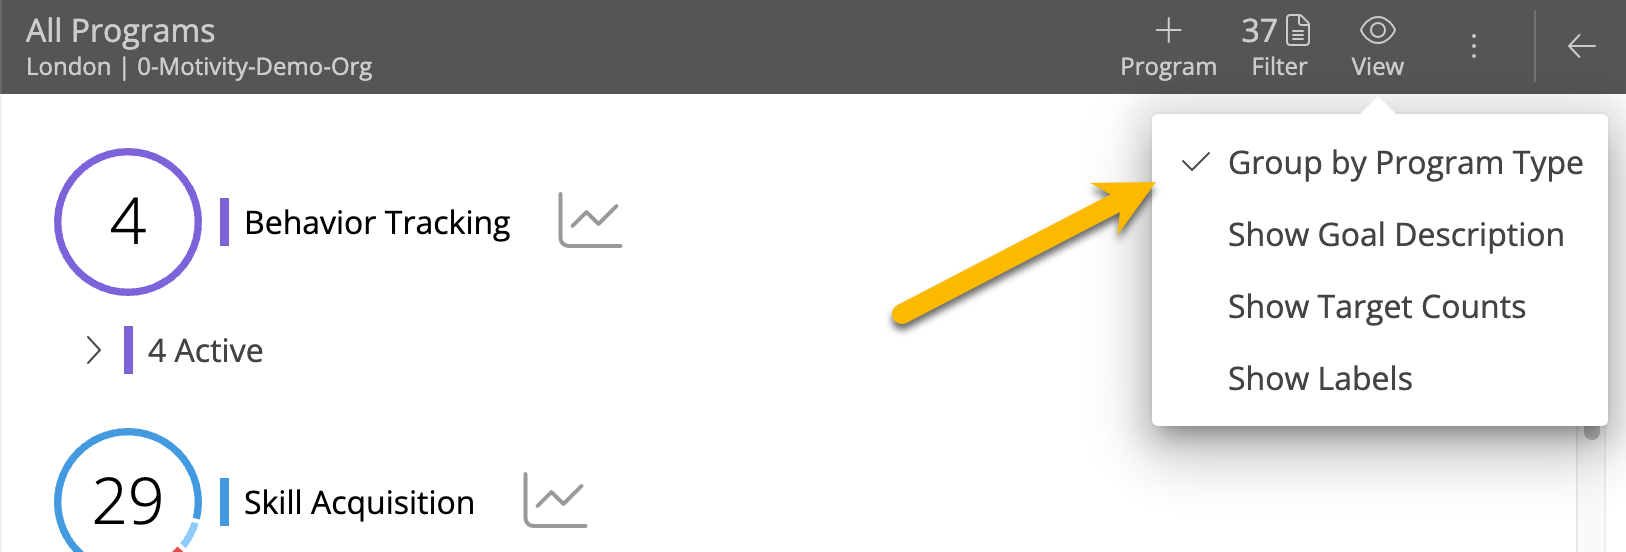
This chart shows how many targets have moved into various phases over time in a specific program type. To access this chart at the learner level, go to learners Programs & Progress and make sure the view is set to "Group by Program Type."

Then select the chart icon to bring up the chart.
At the Program Level or Set Level:
To access the cumulative graphs for a program or set:
- Select a program in your learner's profile.
- Click on the set or the program name or click on the chart icon next to the program or set name.
This will bring up a cumulative graph that shows you the number of targets in a program or set that moved through phases over a period of time.

You can customize and edit your cumulative chart in the following ways:
1. Choose the phases included on the chart
You can select 1 or more phases to include on the chart. For example, you can choose to see only targets moving into and out of the completed phase or you can choose to see targets from both completed and maintenance phases.
Use the dropdown to select 1+ phases to include. Click on a selected phase to deselect it.

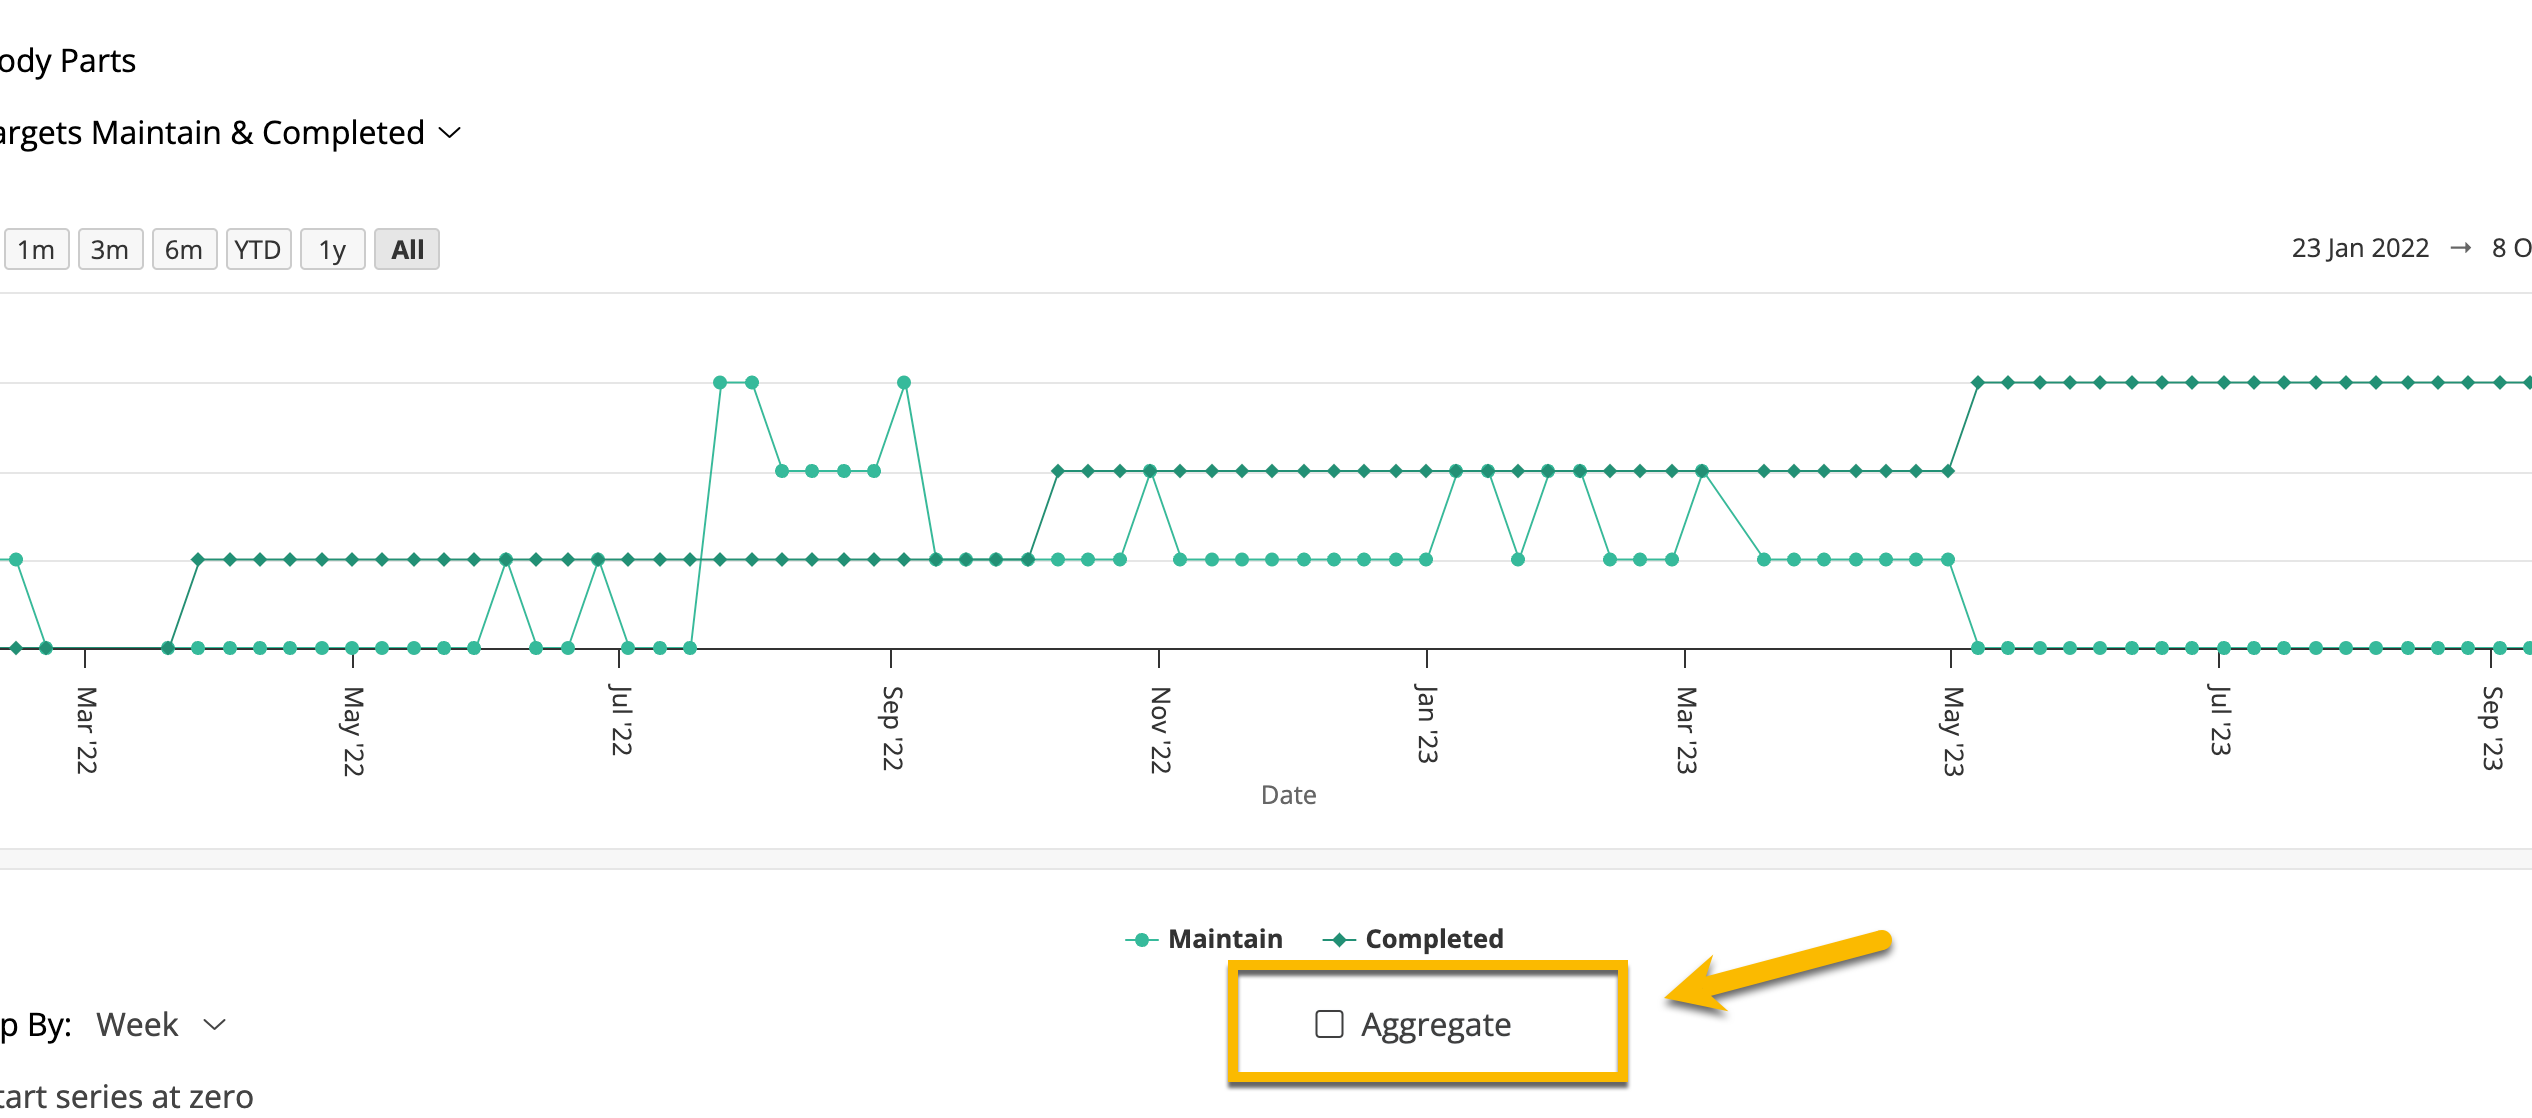
2. Choose to aggregate into one data path or split data by phase
You can change this by checking and unchecking the "Aggregate" box. A checked box will produce one data path for all phases while an unchecked box will show one data path per phase selected.

3. Choose the time frame for the chart
You can use the zoom feature to select the last 1 month, 3 months, 6 months, year to date, 1 year, or all data.
You can also manually enter the time frame on the right side by selecting a start and end date.

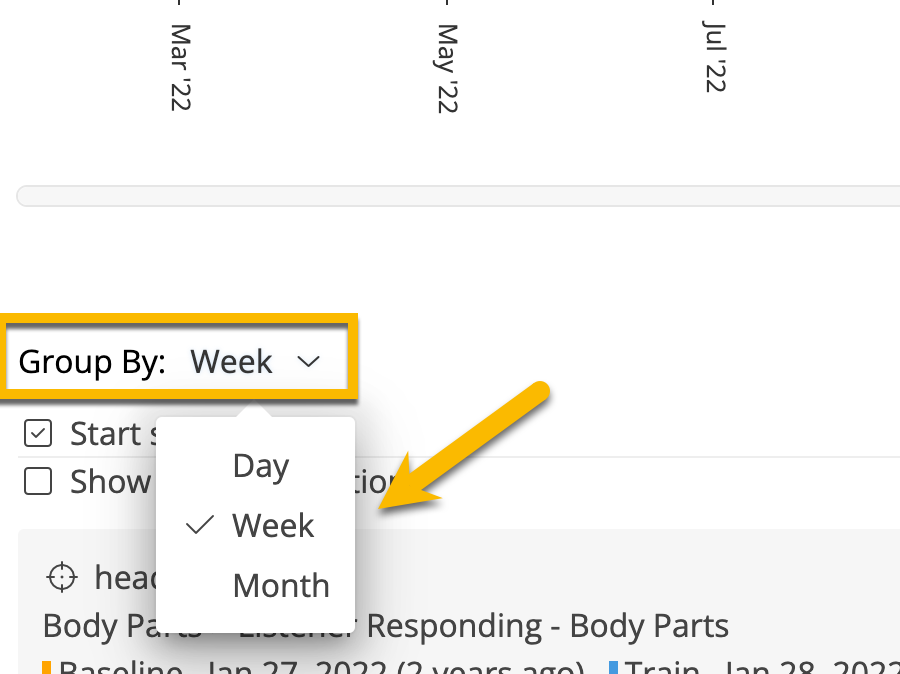
4. Select how data are grouped
Data points can be grouped by date, week, or month. This can be selected below the graph on the left hand side.

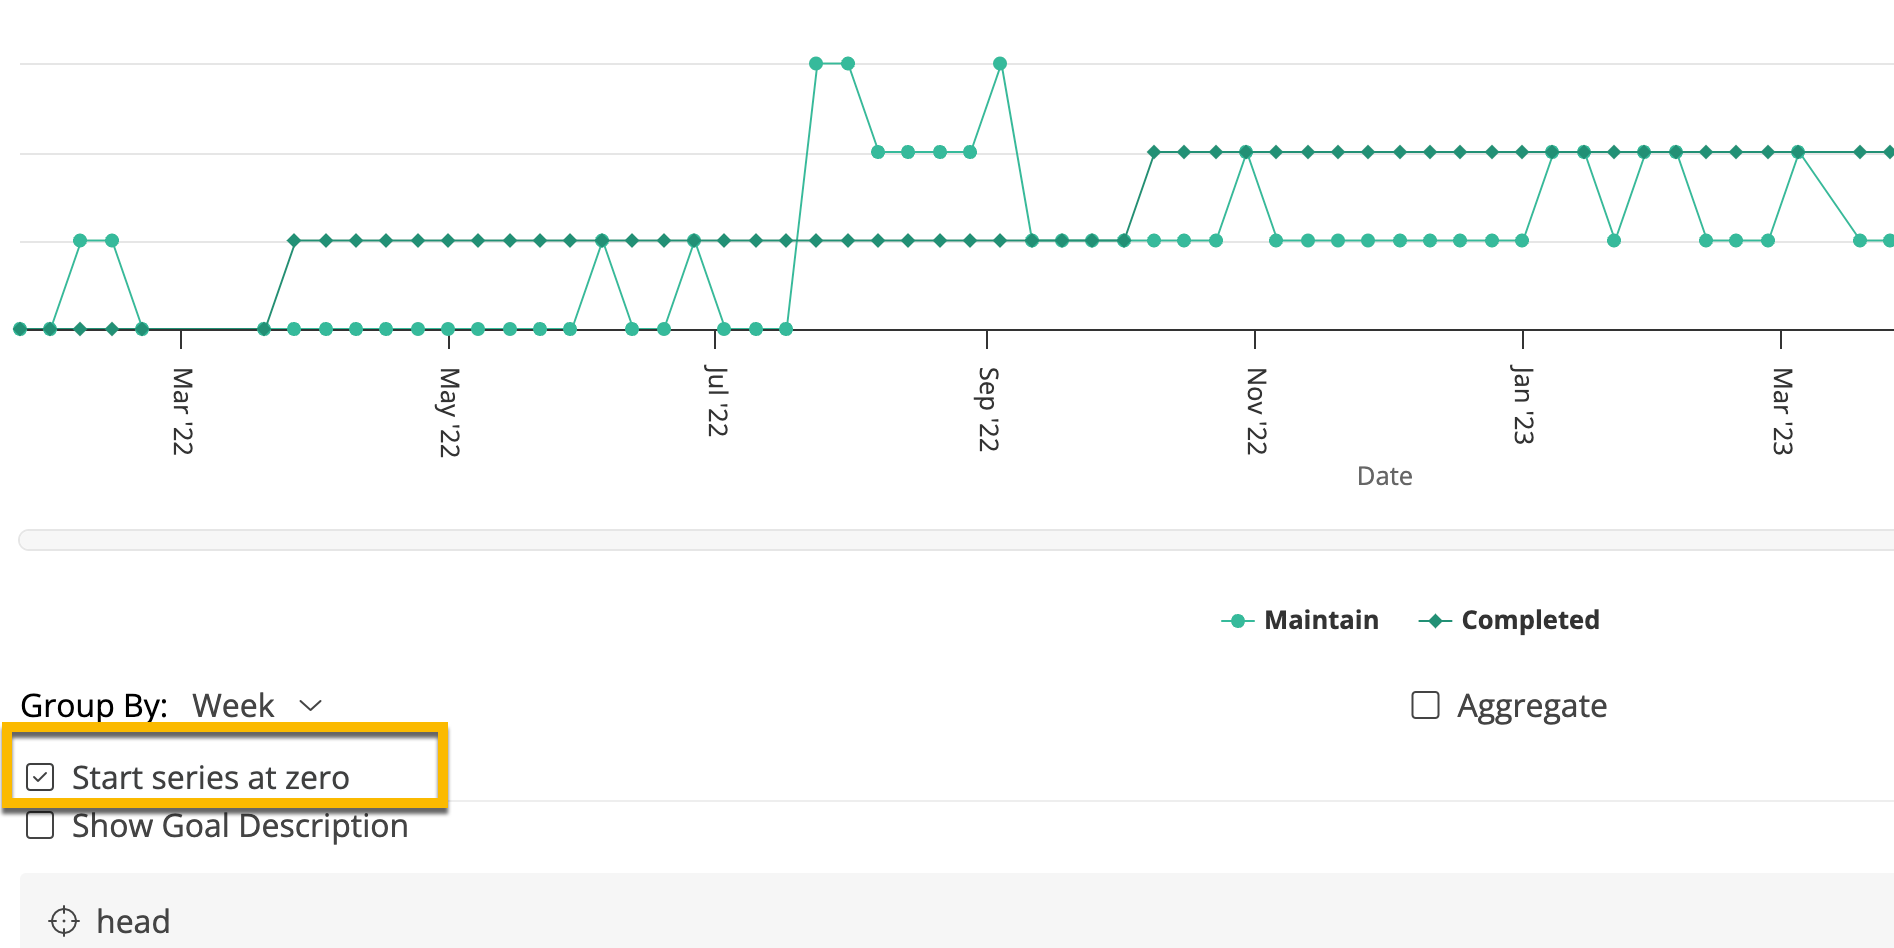
5. Select if you want the graph to start at zero for your time frame
You can check the start at zero box if you would like the cumulative charts to start at zero or uncheck it to have the data path continue from the time prior to the chart's beginning date.

6. Select if you want the goal descriptions to be included in the list of targets below the graph.
Below the graph you will see a list of all targets that moved into the selected phases during your time frame. Each target will also show the journey that the target has taken from when it was introduced until the current phase.
Check the goal description box to choose to show the goal in the list of targets.

Last reviewed:10/13/23