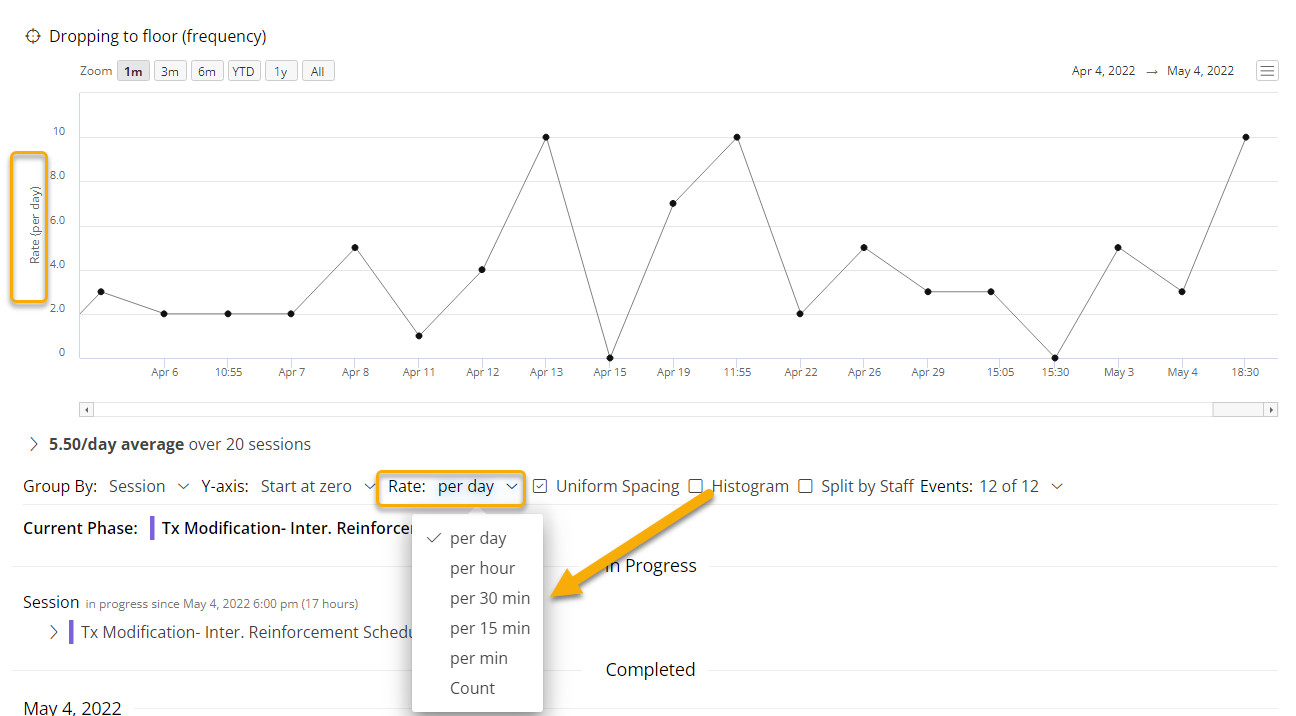
You can change the Y-axis to display different rate measurements. You have the options to toggle between rate per day, per hour, per 30 min, per 15 min, per min, and Count.
To switch between these different views, click on the Rate tool at the bottom of the graph. Click on the drop-down menu and then select which rate you want to be displayed on your graph.

Note: Though the rate tool is displayed across all graph types, it will only affect graphs that are measuring rate.
Last Reviewed: 8/12/22