You can print or save multiple target charts and/or cumulative charts through the export feature. You can export your charts as a PDF, or a Zip file with each chart as a JPG.
To use the Bulk Export Charts feature:
1. Navigate to the learner's dashboard
2. Click on either "Timeline and Reports" or "Programs and Progress"
3. Click on "Export" (found at the top right of the screen)

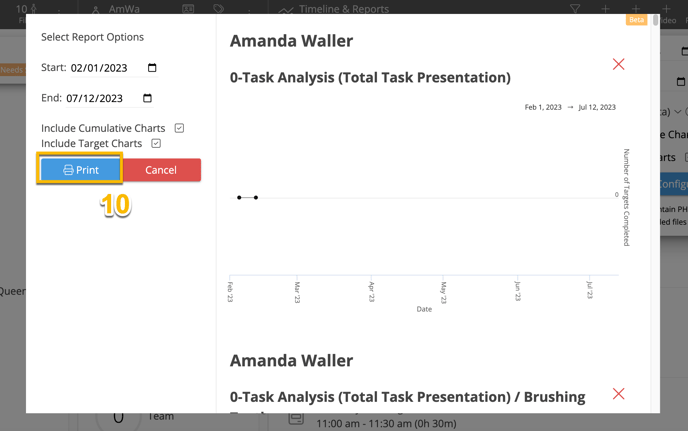
4. Input the date range for your charts
5. For a PDF, under "Export" select "Charts (PDF)"
6. Select which charts you want to export
7. Click "Configure"

Note: As of February 2024, you can also choose to export your charts/graphs in JPG format. This will render a Zip file of all your charts in JPG format. To select this, choose "Charts (Zipped JPGs)" as seen below:

8. If you choose "Charts (PDF)" the charts will load, and the "Print" button will highlight blue when it is ready

9. You can review the charts in the configure box before printing.
a. To remove a chart from the report, click on the red "X"

b. Under target charts you can either expand the summary or leave it collapsed (it will print as it looks in the configure box)

10. When you have set everything up, click on "Print" to either print or save as a PDF.
If you choose to download as JPGs, click "Export" - then your file will generate within the zip file until the green check appears. At that time, the Zip file is ready to be saved and opened.

A few notes:
- How long the charts take to configure will depend on how many charts a learner has and the date range you have selected.
- All charts will be in the date range that you selected
- To change other chart settings (e.g., group by, y-axis, trend lines, histograms, etc.), you will need to change these on the individual charts before using the export feature. Settings remain changed on charts until you manually change them again.
If you are interested in converting the downloaded PDF to a Word document, please see this article
Updated: 4/4/24